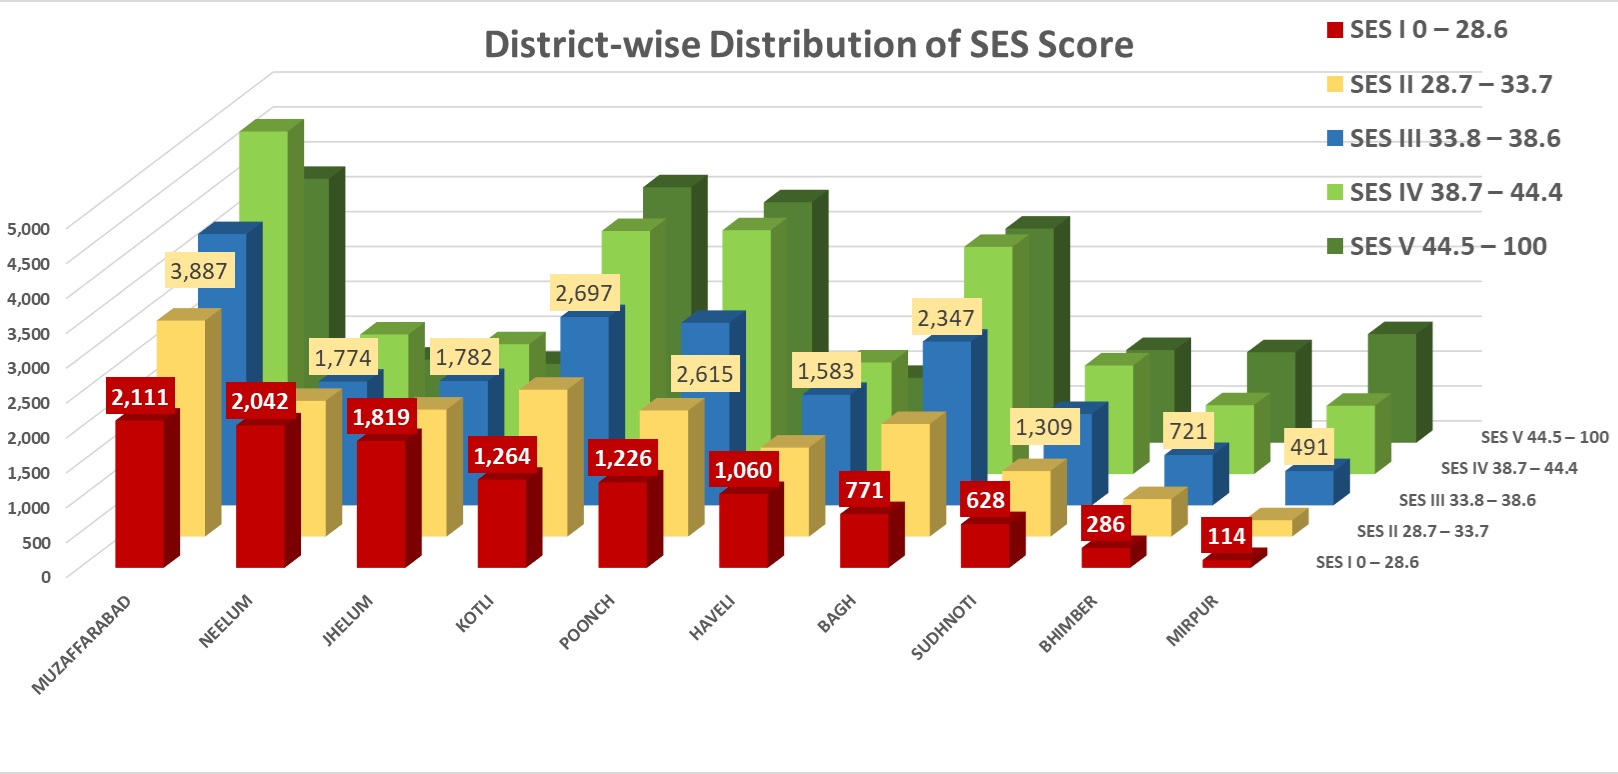
Azad Government of the State of Jammu & Kashmir received 118,825 applications under under Social Protection Program out of which 108,008 applications found correct in all respect. The analysis of received applications on the basis of Socio-Economic Status (SES) across different districts, categorized into five SES levels ranging from SES I (lowest) to SES V (highest), along with the total population count. Here’s a breakdown and analysis of the data:
SES I (0 – 28.6): The lowest socio-economic group comprises 11,321 individuals.
SES II (28.7 – 33.7): This group includes 15,372 individuals, indicating a slight improvement compared to SES I.
SES III (33.8 – 38.6): This category contains 19,206 individuals
SES IV (38.7 – 44.4): The second-highest socio-economic group comprises 24,125 individuals, representing a larger segment.
SES V (44.5 – 100): The highest socio-economic group has 21,402 individuals, indicating a considerable portion of the population is in this category.
Further insight of the data depicts that following facts:
- Muzaffarabad has the highest number of individuals in SES I among all districts, indicating that it has a significant vulnerable population. Combined with SES II, the total vulnerable population here is 5,206, which is one of the highest in the region.
- The total vulnerable population in Neelum is 3,138, showing that a considerable portion of the population faces economic hardships. This district has one of the higher numbers of vulnerable individuals, especially in SES II.
- Jhelum Valley numbers indicate that the district has a moderately high number of vulnerable individuals, primarily in SES II. The combined total for SES I and SES II is 2,951
- Kotli has a total of 3,369 individuals in the vulnerable SES groups, making it another district with a considerable disadvantaged population. SES II is particularly high, showing that a notable segment of the population has low but slightly improved socio-economic standing compared to SES I.
- The total vulnerable population here is 3,033. Poonch has a balanced distribution of vulnerable populations between SES I and SES II, indicating ongoing socio-economic challenges
- The combined vulnerable population in Haveli is 2,530. While lower compared to other districts, it still shows that nearly a third of the lower SES individuals are in the most disadvantaged group (SES I).
- Bagh’s total vulnerable population is 2,335, which is one of the lower totals in the region, but still significant. The focus should be on SES I, where a sizable portion faces severe socio-economic constraints.
- The total for these groups is 1,710, one of the lowest among districts. This suggests that Sudhnuti has relatively fewer individuals in the lowest SES groups, but they still require attention for upliftment.
- Bhimber has a vulnerable population of 1,349, indicating that this district has comparatively fewer people in the lowest SES categories. However, targeted support for this small group is crucial.
- Mirpur has the smallest vulnerable population with a total of 705, indicating it is the least vulnerable district. The focus should be on transitioning this small group into higher SES levels.
